
New Social Places AI-Powered Reporting across Product Modules
Your monthly report used to be a PDF. Fifty pages. Loaded with charts. Sent to someone who forwarded it to someone who saved it to a folder nobody ever opened again. The AI Insights Hub changes all of that.
For brand managers overseeing dozens or hundreds of locations, the gap between data and a decision is often a reporting problem: too much noise, too little context, and a format that was never built for the people who actually need to use it. The AI Insights Hub Reporting is built to close that gap, for every person in the room.
“The gap in multi-location brands isn’t data. It’s the distance between the data and a decision. A CEO doesn’t need a chart, they need a topline overview. A store manager doesn’t need a dashboard, they need to know what to fix on Monday. The Insights Hub closes that gap for every stakeholder, from one report. – Ryan Haworth (CEO – Social places)
What’s New
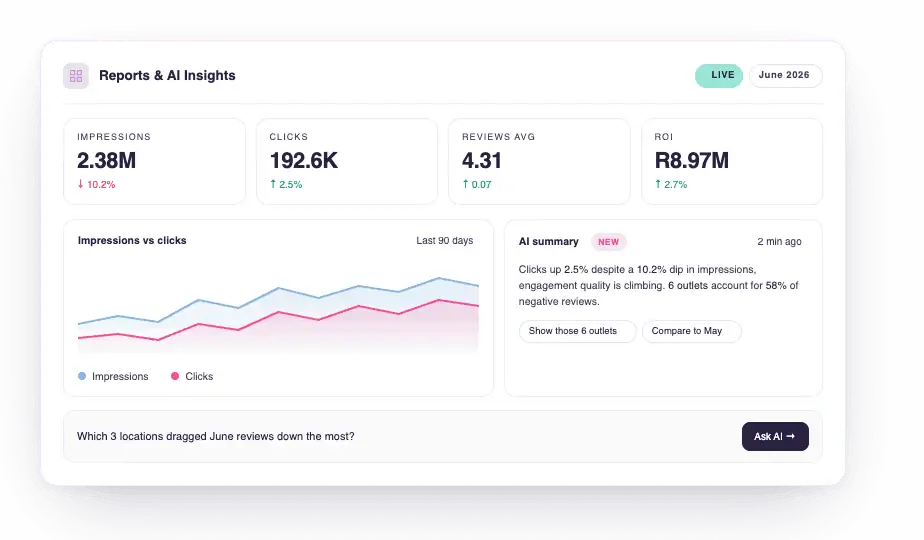
- Cross-suite reporting in a single report: For the first time, one Insights Hub report can pull data across multiple Social Places product modules simultaneously – listings, reputation, and social performance together, without switching between separate reports.
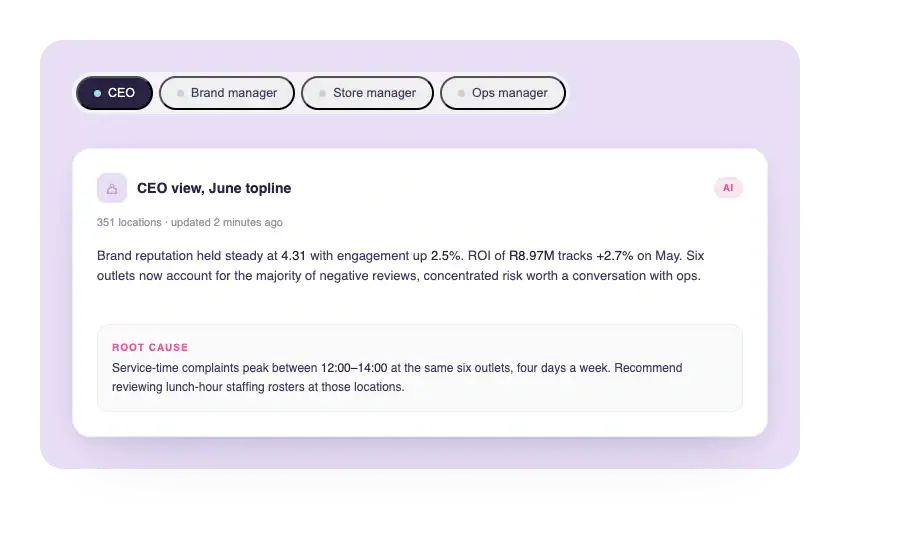
- Stakeholder-specific views: The same report delivers different outputs for different roles. A CEO gets a topline overview. A brand manager gets stats and flagged concerns. A store manager gets strengths and weaknesses written in plain language. An ops manager gets a consolidated regional summary. Each person sees exactly what they need.
- AI-generated section summaries: Each report section includes an AI summary that interprets the data rather than restating it. Trends are surfaced, shifts versus the prior period are highlighted, and the blocks worth your attention are called out.
- Deeper AI root cause analysis: The AI does not just flag a problem – it investigates it. If service time appears as an issue, the AI surfaces whether this is isolated to specific stores, concentrated at certain times of day, or a pattern that repeats across particular days of the week. Conclusions a human analyst would take hours to reach are surfaced automatically.
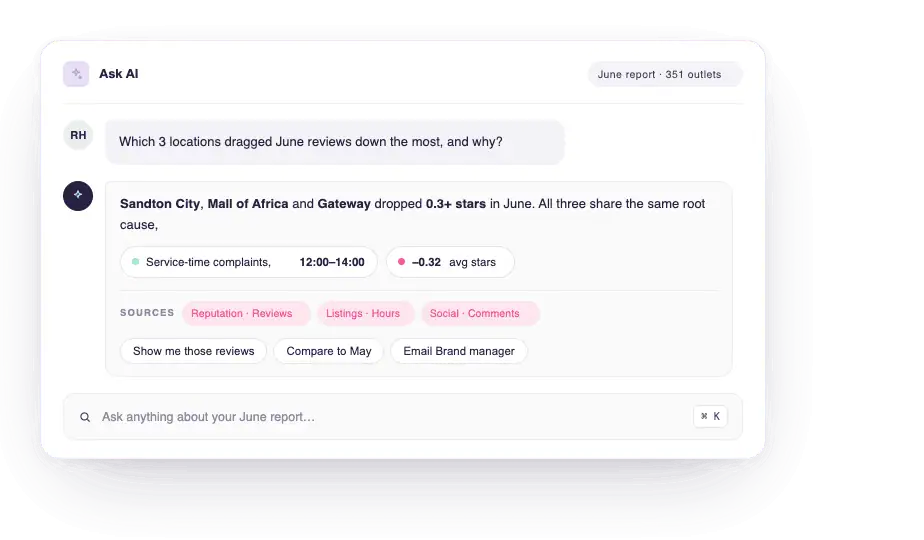
- Ask AI: Type a natural language question directly inside a report and get an instant answer without pulling a separate export. No additional tools required.
- Bayesian review score: A new reputation score that weights both the quantity and quality of reviews together, so a single bad review in a quiet month does not distort a location’s overall performance.
- Dynamic regional map: A performance map that rescales relative to the brand’s own average rather than a fixed benchmark, making it easier to identify which regions are genuinely underperforming in context.
- Composable report blocks: Move, filter, and customise data blocks across Overview, Reputation, Social, and Listings views. Start from a pre-built template or a blank canvas.
- Flexible PDF export: Export as a single combined PDF, a current-view PDF, or separate PDFs per section delivered as a zip. All formats mirror the interactive layout with a table of contents and quick-link navigation.
- Viewer and editor sharing: Share reports with viewer access (filter without saving) or editor access (save changes). Plug directly into Social Places’ existing report scheduling system for automated distribution.
AI Reporting Insights. Who is This For?
The AI Insights Hub is relevant to any multi-location brand that currently loses time building manual reports or sending the same document to stakeholders who need completely different information from it.
At brand level, the Insights Hub is available to all Social Places accounts on launch at no additional cost and includes AI insights across your full brand footprint.
How does the AI Insights Hub for Reporting work
Reports are organised into four views: Overview, Reputation, Social, and Listings. Each view is built from data blocks you can move, filter, and customise to match your reporting needs.
- Start from a template or a blank canvas. Pre-built templates cover the most common reporting structures. Add or remove blocks to match the metrics that matter to your brand.
- Set your stakeholder view. Choose which audience this version of the report is built for – CEO, brand, store, or ops manager. The AI tailors its summaries and plain-language output to match the level of detail appropriate for that reader.
- Review AI-generated summaries per section. Each section interprets the data relative to the previous period. The AI does not stop at surfacing a trend – it investigates root cause. A service time issue, for example, will be followed by the AI identifying whether it is store-specific, time-of-day driven, or a recurring pattern across certain days of the week.
- Ask questions directly in the report. The Ask AI section accepts natural language queries. Type “What was the review average for our brand over Q1 2026?” and receive an instant answer from within the report.
- Use the Bayesian score to identify real reputation issues. The score accounts for review volume and quality together. A location with one bad review in a slow month is weighted differently from a location consistently accumulating negative feedback.
- Check the dynamic regional map for relative performance. The map recalibrates against the brand’s own average, not a fixed national benchmark. A province scoring 4.2 looks very different when the brand average is 4.5.
- Set date ranges, apply filters, and save the structure. Use rolling windows like “last 7 days” or lock to a fixed period. Save the full report layout for reuse.
- Export and share. Choose your format and assign viewer or editor access. Connect to the scheduling system for automated distribution.
Important: What This Changes for Existing Reports
The Insights Hub launches as an addition to your existing Social Places reports – your current report setup remains in place. Over time, the Insights Hub will replace the existing report format. Your account manager will communicate the transition timeline for your account.
How to Access It
Brand-level reporting is available to all Social Places accounts from launch. If you do not yet see the Insights Hub in your dashboard, contact your account manager.
Store-level reporting is available at no cost, however AI insights are charged for. Reach out to your account manager or get in touch to discuss store-level access for your brand.
Ready to See It in Action?
The AI Insights Hub is part of an ongoing investment in making reputation and listings performance data easier to act on – for every person who needs to use it, not just the person who built the report. Contact Us to arrange a walkthrough or to discuss store-level access for your brand.
We have some exciting additions coming to our reports over the next 2 months.
FAQ on AI Insights
Brand-level reporting in the Insights Hub is available to all Social Places accounts on launch. Store-level reporting is also available however deeper store-specific AI insights require tokens. Contact your account manager to discuss access options for your brand.
Yes. The Insights Hub supports three export formats: a single combined PDF, a current-view PDF, and separate PDFs per section delivered as a zip. All exports mirror the interactive layout and include a table of contents with quick-link navigation.
A standard review average treats each review equally, which makes it vulnerable to outliers. The Bayesian score weights both the quantity and quality of reviews together, so a single bad review in a quiet month has far less impact than consistent negative feedback across a busy period. This gives a more reliable signal for identifying genuine reputation issues rather than isolated incidents.
The dynamic regional map recalibrates the colour scale relative to the brand’s own average, rather than a fixed national scale. This makes it far easier to identify which regions are genuinely underperforming relative to where the brand sits, even when all locations are technically above a minimum threshold.